
この記事では、前回の記事「【D3.jsで日本地図描画①】Natural Earth からGeoJSONを作成するスクリプト」で生成したGeoJSONとD3.jsを使用して画面上に日本地図を描画する方法を解説する。この記事の実装は、単なる静的な地図表示ではなく、都道府県のホバー・クリックイベントに対応したものであり、アプリケーションやゲーム内でインタラクションに活用することを想定している。
開発環境
Next.js v15 App Routerで動作確認を行なっている。以下は、Next.js Reactのバージョンと、今回の実装で使用するd3.jsのバージョン。
"@types/d3": "^7.4.3",
"@types/d3-geo": "^3.1.0",

"d3": "^7.9.0",
"d3-geo": "^3.1.1",

"next": "15.3.3",
"react": "^19.0.0",
"react-dom": "^19.0.0",
ゴール
最終的に以下の機能を持つ日本地図を作成する:
- 地理的投影: メルカトル図法による日本地図の描画
- インタラクション: 都道府県のホバー時の色変更
- 選択機能: クリック時の都道府県ハイライト
実装の全体像
D3.jsによる地図描画は以下の流れで実現される:
- GeoJSONデータの読み込み:Natural Earthの都道府県データを取得
- 地理投影の設定:経緯度座標をSVG座標系に変換
- SVGパスの生成:GeoJSONの座標からSVGのpath要素を作成
- イベントハンドリング:マウスイベントによるインタラクション
必要なライブラリのインストール
$ npm install d3 d3-geo
$ npm install --save-dev @types/d3 @types/d3-geo
ライブラリの役割
- d3: データ駆動型ドキュメント操作のコアライブラリ
- d3-geo: 地理投影・座標変換・GeoJSON処理の専用モジュール
- @types/d3, @types/d3-geo: TypeScriptの型定義
プログラムの完全実装
src/app/test-map/page.tsxを作成し、以下のように実装する。
"use client";

import React, { useRef, useEffect } from "react";
import * as d3 from "d3";
import { geoMercator, geoPath } from "d3-geo";

// GeoJSONの型定義(Natural Earthデータ用)
interface NaturalEarthProperties {
  // 実装で使用する主要プロパティ
  name?: string; // 英語名
  name_ja?: string; // 日本語名
  name_local?: string; // ローカル名
  name_en?: string; // 英語名(明示的)
  region?: string; // 地方
  iso_a2?: string; // 国コード
  admin?: string; // 国名

  // その他のプロパティは動的に扱う
  [key: string]: any;
}

interface CustomGeoJSONGeometry {
  type: "Polygon" | "MultiPolygon";
  coordinates: number[][][] | number[][][][];
}

interface CustomGeoJSONFeature {
  type: "Feature";
  properties: NaturalEarthProperties;
  geometry: CustomGeoJSONGeometry;
}

interface CustomGeoJSONFeatureCollection {
  type: "FeatureCollection";
  features: CustomGeoJSONFeature[];
}

const Index: React.FC = () => {
  const mapContainerRef = useRef<HTMLDivElement>(null);

  // D3.js設定
  const width = 800;
  const height = 800;
  const backgroundColor = "#4A90E2"; // 青い背景

  let svg: d3.Selection<SVGSVGElement, unknown, null, undefined>;
  let g: d3.Selection<SVGGElement, unknown, null, undefined>;
  let projection: d3.GeoProjection;
  let path: d3.GeoPath;

  // 地図データ読み込み
  const loadMapData = async (): Promise<CustomGeoJSONFeatureCollection | null> => {
    try {
      const response = await fetch("/natural-earth/ne_10m_admin_1_states_provinces.json");
      const data: CustomGeoJSONFeatureCollection = await response.json();
      return data;
    } catch (error) {
      console.error("地図データ読み込みエラー:", error);
      return null;
    }
  };

  // D3.js地図初期化
  const initMap = (data: CustomGeoJSONFeatureCollection) => {
    if (!mapContainerRef.current || !data) return;

    // 既存のSVGをクリア
    d3.select(mapContainerRef.current).selectAll("*").remove();

    // SVG作成
    svg = d3
      .select(mapContainerRef.current)
      .append("svg")
      .attr("width", width)
      .attr("height", height)
      .style("background-color", backgroundColor);

    g = svg.append("g");

    // 投影設定 (日本用)
    projection = geoMercator()
      .center([138, 38]) // 日本の中心
      .scale(1200)
      .translate([width / 2, height / 2]);

    path = geoPath().projection(projection);

    drawMap(data);
  };

  // 地図描画
  const drawMap = (data: CustomGeoJSONFeatureCollection) => {
    if (!data) return;

    // 全ての都道府県を表示
    const featurestoShow = data.features;

    // 既存のパスをクリア
    g.selectAll("path").remove();
    g.selectAll("text").remove();

    // 都道府県境界描画
    g.selectAll("path")
      .data(featurestoShow)
      .enter()
      .append("path")
      .attr("d", (d) => path(d as d3.GeoPermissibleObjects))
      .attr("fill", "#e8f4fd")
      .attr("stroke", "#2c5282")
      .attr("stroke-width", 1.5)
      .style("cursor", "pointer")
      .on("mouseenter", function () {
        d3.select(this).attr("fill", "#ffd700").attr("stroke-width", 2);
      })
      .on("mouseleave", function () {
        d3.select(this).attr("fill", "#e8f4fd").attr("stroke-width", 1.5);
      })
      .on("click", function (event, d) {
        // クリック処理
        console.log(
          `クリック: ${d.properties.name_ja || d.properties.name_local || d.properties.name} (${
            d.properties.name
          })`
        );

        // 全ての都道府県をリセット
        g.selectAll("path").attr("fill", "#e8f4fd").attr("stroke-width", 1.5);

        // 選択された都道府県をハイライト
        d3.select(this).attr("fill", "#ff6b6b").attr("stroke-width", 3);
      });
  };

  useEffect(() => {
    const loadAndInitMap = async () => {
      const data = await loadMapData();
      if (data) {
        initMap(data);
      }
    };

    loadAndInitMap();

    // クリーンアップ用に現在の要素を保存
    const currentContainer = mapContainerRef.current;

    // クリーンアップ
    return () => {
      if (currentContainer) {
        d3.select(currentContainer).selectAll("*").remove();
      }
    };
  }, []);

  return (
    <div>
      <div ref={mapContainerRef}></div>
    </div>
  );
};

export default Index;
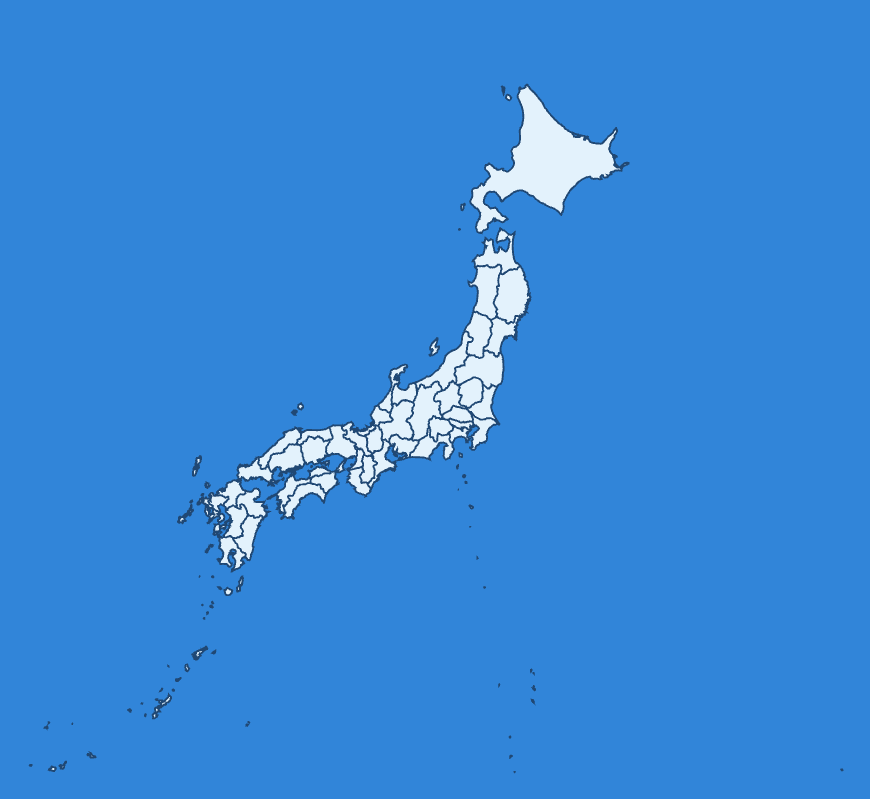
npm run devでプロジェクトを起動し、http://localhost:3000/test-mapにアクセスすると以下のように表示される。
地図は、都道府県別に個別選択できるようになっているので、ホバーすると色が変わり、クリックイベントも処理ができる。
コードの詳細解説
1. データ読み込み処理
const loadMapData = async (): Promise<CustomGeoJSONFeatureCollection | null> => {
  try {
    const response = await fetch("/natural-earth/ne_10m_admin_1_states_provinces.json");
    const data: CustomGeoJSONFeatureCollection = await response.json();
    return data;
  } catch (error) {
    console.error("地図データ読み込みエラー:", error);
    return null;
  }
};仕組み:
- 非同期処理:
fetchを使用してGeoJSONファイルを非同期取得 - 型安全性: 取得したデータを
CustomGeoJSONFeatureCollection型にキャスト - エラーハンドリング: ネットワークエラーやファイル不存在に対応
ポイント:
- GeoJSONファイルは
publicディレクトリに配置する必要がある - 型キャストにより、以降の処理で型安全にプロパティアクセス可能
2. 地理投影の設定
projection = geoMercator()
  .center([138, 38]) // 日本の中心
  .scale(1200)
.translate([width / 2, height / 2]);仕組み:
- メルカトル図法: 経緯度座標をSVG座標系に変換する投影方式
- center: 投影の中心点を日本の地理的中心(経度138°、緯度38°)に設定
- scale: 地図の拡大率を調整(値が大きいほど拡大)
- translate: SVG座標系での表示位置を画面中央に設定
座標変換の仕組み:
経緯度座標 [longitude, latitude] → SVG座標 [x, y]
例: [139.6917, 35.6895] (東京) → [450, 380] (SVG上の座標)
3. パス生成とSVG描画
path = geoPath().projection(projection);

// パス要素の生成
.attr("d", (d) => path(d as d3.GeoPermissibleObjects))仕組み:
- geoPath: GeoJSONの座標配列をSVGのpath文字列に変換
- projection連携: 設定した投影関数を使用して座標変換
- SVGパス: 都道府県の境界線を表現するベクター形状
座標変換の流れ:
GeoJSON座標配列 → 投影変換 → SVGパス文字列
[[[lng1,lat1],[lng2,lat2]...]] → geoPath → "M x1 y1 L x2 y2 ... Z"
4. インタラクティブ機能
.on("mouseenter", function () {
  d3.select(this).attr("fill", "#ffd700").attr("stroke-width", 2);
})
.on("mouseleave", function () {
  d3.select(this).attr("fill", "#e8f4fd").attr("stroke-width", 1.5);
})
.on("click", function (event, d) {
  // 選択状態の管理
  g.selectAll("path").attr("fill", "#e8f4fd").attr("stroke-width", 1.5);
  d3.select(this).attr("fill", "#ff6b6b").attr("stroke-width", 3);
});仕組み:
- D3イベントハンドリング: SVG要素に直接イベントリスナーを追加
- this参照: コールバック内の
thisは対応するDOM要素(path要素) - d3.select(this): 現在の要素をD3セレクションとして操作
- データアクセス: 第二引数
dでGeoJSONフィーチャーデータにアクセス
状態管理パターン:
- ホバー時: 該当要素のみスタイル変更
- クリック時: 全要素をリセット後、選択要素をハイライト
- データ取得:
d.propertiesで都道府県情報にアクセス
以上。